Statistic Basic
Variance
\[ V\left(X\right) = E[\left(X - E[X]\right)^2] = E[X^2] - E[X]^2 \]
Covariance
\[ cov\left(X, Y\right) = E[\left(X - E[X] \right)\left(Y - E[Y]\right)] = E[XY] - E[X]E[Y] \] \[ cov\left(X, X\right) = V\left(X\right) \]
Correlation
Corrlation is a normalized Covariance, whose value range is [-1, 1]. A value of +1 is total positive linear correlation, 0 is no linear correlation, and −1 is total negative linear correlation \[ \rho\left(X, Y\right) = \frac{cov\left(X, Y\right)}{\sqrt{V\left(X\right)}\sqrt{V\left(Y\right)}} = \frac{E[XY] - E[X]E[Y]}{\sqrt{E[X^2] - E[X]^2}\sqrt{E[Y^2] - E[Y]^2}} \]
Autocorrelation
Autocorrelation, also known as serial correlation, is the correlation of a signal with a delayed copy of itself as a function of delay.
Hypothesis Testing
Null Hypothesis
The null hypothesis, $H_0$ is the commonly accepted fact; it is the opposite of the alternate hypothesis. Researchers work to reject, nullify or disprove the null hypothesis. Researchers come up with an alternate hypothesis, one that they think explains a phenomenon, and then work to reject the null hypothesis.
Unit Root
A unit root (also called a unit root process or a difference stationary process) test is a stochastic trend in a time series, sometimes called a “random walk with drift”; If a time series has a unit root, it shows a systematic pattern that is unpredictable.
P-Value
A p value is used in hypothesis testing to help support or reject null hypothesis. The p value is the evidence against a null hypothesis. The smaller the p-value, the stronger the evidence that you should reject null hypothesis.
Likelihood-Ratio TestThe Likelihood-Ratio test (sometimes called the likelihood-ratio chi-squared test) is a hypothesis test that helps you choose the “best” model between two nested models.
Plot
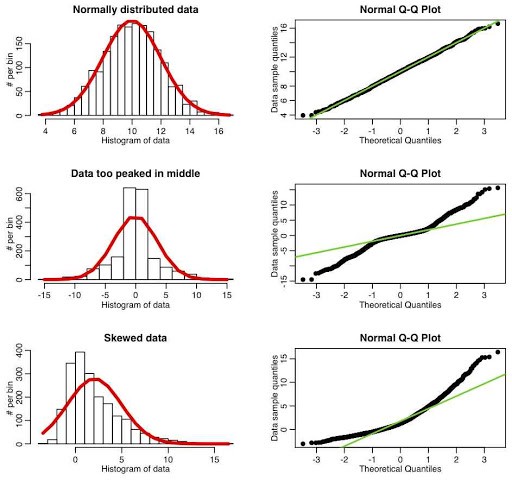
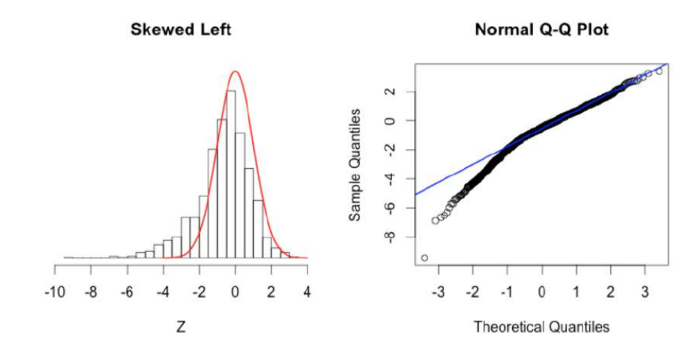
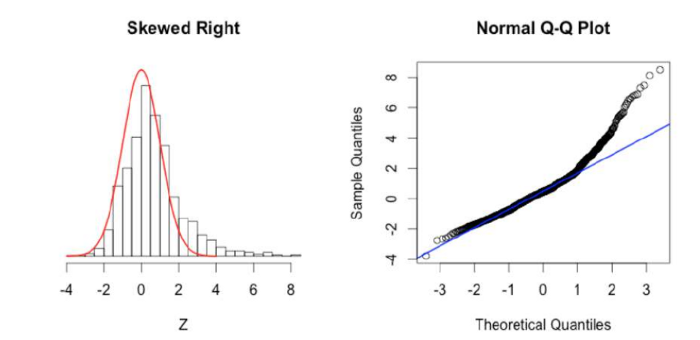
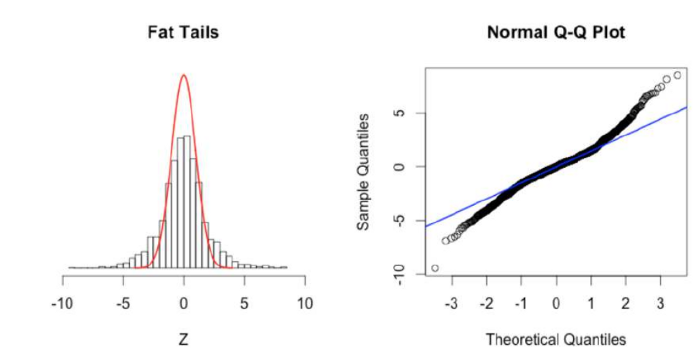
Quantile-Quantile Plot
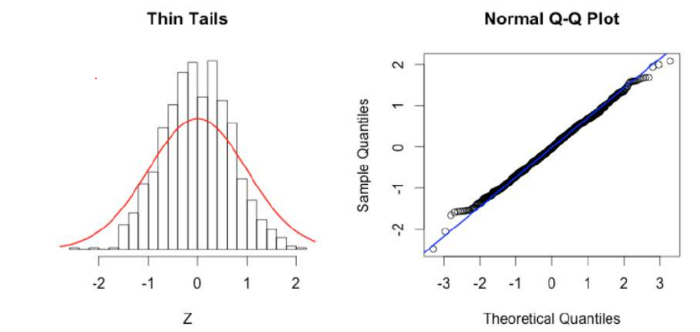
Q Q Plots (Quantile-Quantile plots) are plots of two quantiles against each other. A quantile is a fraction where certain values fall below that quantile. For example, the median is a quantile where 50% of the data fall below that point and 50% lie above it. The purpose of Q Q plots is to find out if two sets of data come from the same distribution. A 45 degree angle is plotted on the Q Q plot; if the two data sets come from a common distribution, the points will fall on that reference line.
Q-Q Plot Samples
Reference